

When a business leader sponsors an international assignment or approves a permanent cross-border transfer, they're making a financial commitment that will play out over months or years. Getting the cost estimate right at the outset is the foundation of the entire business case. Underestimate, and you're managing an awkward conversation mid-assignment about why costs are running over. Overestimate, and you risk killing a strategically important move before it ever gets off the ground. The expectation you set on day one shapes everything that follows.
Long-term assignments: The 3-4x Rule Is Dead. Here's What Mobility Actually Costs.
For decades, global mobility has operated on a comfortable shorthand: an international assignment costs roughly three to four times the employee's base salary. It was a rule of thumb that fit neatly on a slide, satisfied a CFO's initial question, and moved the conversation forward. The problem? It was never really accurate, and AIRINC's latest cost analysis proves just how wide the gap between assumption and reality has become.
Using their Assignment Cost Estimator and tax engine, AIRINC modeled 40 real-world routes across two program types: long-term assignments and one-way transfers. Each are broke into the three core cost drivers: salary and social security, allowances, and tax costs. The results are a wake-up call.
Above chart courtesy of AIRINC.
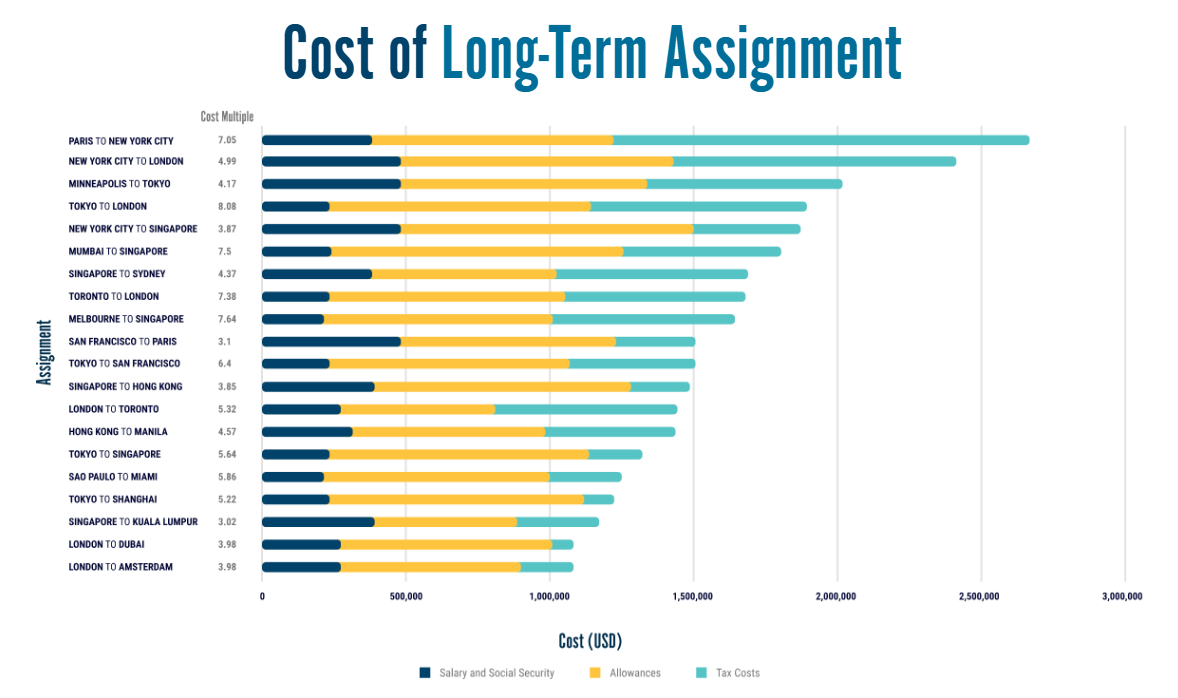
Long-Term Assignments: The Tax Variable Nobody's Budgeting For
Across 20 long-term assignment routes, cost multiples range from 3.02x salary (Singapore to Kuala Lumpur) all the way to 8.08x salary (Tokyo to London). The same employee on two different routes can represent a cost difference of nearly 5x salary before a single business outcome is measured.
The outliers tell the real story. Paris to New York City comes in at 7.05x salary. Mumbai to Singapore hits 7.50x salary. Melbourne to Singapore reaches 7.64x salary. Toronto to London lands at 7.38x salary. In every one of these cases tax costs are the primary culprit, not allowances, not base compensation. When a company is providing tax equalization on a high-tax-to-high-tax route, the gross-up obligations alone can dwarf every other line item in the assignment budget.
By contrast, routes like San Francisco to Paris (3.10x salary), Singapore to Kuala Lumpur (3.02x salary), and New York City to Singapore (3.87x salary) show that smart routing and destination selection can keep costs dramatically lower on a comparable talent investment.
The old 3-4x salary rule? It applies to exactly a handful of these routes. For the majority, it's either an underestimate or doesn't come close.
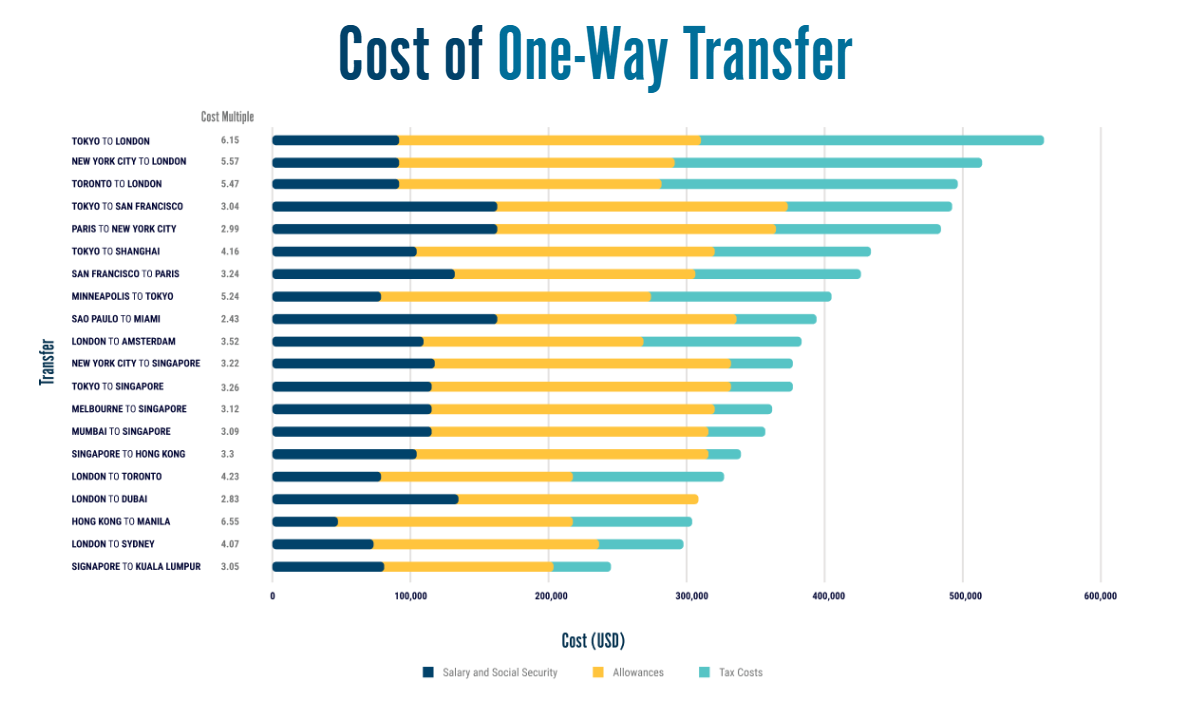
Looking at One-Way Transfers: A Different Animal
International one-way transfers are increasingly common as companies continue moving away from traditional long-term assignment structures toward one-way “permanent” relocations, and many mobility programs are treating them as the cheaper, simpler alternative. The data suggests that's not always the case.
Tokyo to London comes in at 6.15x salary on a one-way basis. New York City to London hits 5.57x salary. Toronto to London reaches 5.47x salary. Minneapolis to Tokyo lands at 5.24x salary. These are permanent moves — there's no repatriation cost, but the tax exposure on certain routes remains substantial, and allowances for localization can be significant.
On the lower end, Sao Paulo to Miami (2.43x salary), London to Dubai (2.83x salary), and Singapore to Kuala Lumpur (3.05x salary) illustrate how much destination selection shapes total cost. Hong Kong to Manila is a striking outlier at 6.55x salary, the highest cost multiple in the entire one-way transfer dataset, driven by an allowance structure that dwarfs salary and social security combined.
Above chart courtesy of AIRINC.
What Mobility Teams Should Be Doing With This
The gap between the cheapest and most expensive routes in both datasets is a budget planning crisis waiting to happen for programs still relying on blended estimates. A mobility team that walks into a talent planning conversation with route-specific cost multiples is having a fundamentally different conversation than one armed with a 3-4x assumption.
The strategic opportunity here is straightforward: get ahead of decisions before commitments are made. When a business leader is told "this Tokyo-to-London long-term assignment will cost 8x salary, primarily driven by tax obligations," that's a conversation that opens doors to alternative structures, adjusted timelines, and different destination options. Late discovery just creates budget problems with no good options left.
The data and modeling tools are there. Advising early with route specific data is how mobility programs become indispensable to their partners.

/Passle/56686a093d94740bd0dda608/SearchServiceImages/2026-06-16-20-52-02-855-6a31b772a440296a8b0794b2.jpg)
/Passle/56686a093d94740bd0dda608/SearchServiceImages/2026-06-15-12-35-31-605-6a2ff193824a95fe48848cb7.jpg)
/Passle/56686a093d94740bd0dda608/SearchServiceImages/2026-06-01-15-34-58-715-6a1da6a2325d492fa0c29633.jpg)