

If your company’s assignees or transferees have been sticker-shocked by rental costs here in the U.S. in recent years, the data confirms what they’re feeling. According to Zillow’s Observed Rent Index (ZORI), average rents across 30 major U.S. cities have surged 36% since 2020. In the fastest-growing Sun Belt metros, that number climbs far higher.
A recent analysis from Voronoi, using Zillow data, charted rent inflation across 30 U.S. metros from January 2020 through January 2026. The results underscore a challenge that’s become a fixture of mobility program management: cost-of-living increases in destination cities are outpacing compensation adjustments, and the gap is widest in the cities many employees actually want to move to (or where companies need/want them to move to).
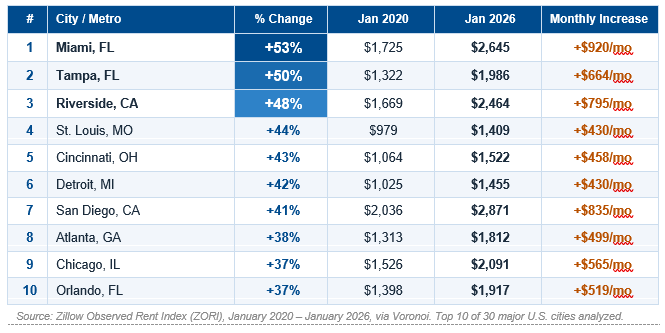
Top 10 Cities: Rent Increase Since 2020
Considering what's driving the surge
Sun Belt migration. Miami’s 53% increase isn’t a fluke — it coincided with a pandemic-era influx of roughly 250,000 new residents. Tampa similarly absorbed nearly 500,000 new residents over the period, pushing rents up 50% even as average rents remained more affordable in absolute terms. Atlanta and Orlando round out the Sun Belt presence in the top 10, each driven by sustained domestic in-migration and tight housing inventory.
The Midwest surprise. Perhaps the most striking finding in the data is how prominently Midwest markets feature in the rankings. St. Louis (+44%), Cincinnati (+43%), Detroit (+42%), and Chicago (+37%) all cracked the top 10. Rents in these markets aren't high in absolute terms, but they surged sharply from low pre-pandemic baselines. In St. Louis, the typical rent of $1,409 is still well below the national average, yet it represents a 44% jump from 2020. For mobility programs, this means affordability assumptions about “reasonably priced” Midwest destinations may need revisiting.
California spillover. Riverside’s 48% increase reflects the classic pattern of residents migrating inland from pricier coastal California metros. San Diego (#7 at +41%) also made the list, reflecting sustained demand pressure even in markets with already high baseline rents.
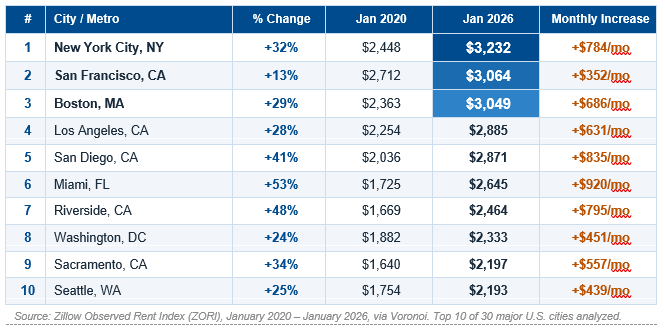
While the above chart showed the greatest percentage change in rent over that period of time, here are the top 10 current highest rents in this data:
Top 10 Cities: Highest Current Rent (January 2026)
The High-Cost Coastal Story
Two very different stories. The cities with the fastest rent growth since 2020 are largely Sun Belt and Midwest markets — places that started cheap and caught up quickly. The cities with the highest absolute rents are an almost entirely different list: established coastal markets where high rents are structural, not pandemic-driven.
New York and the coastal cluster. Per the Zillow data, New York City leads all 30 markets at $3,232/month. That's a 32% increase from $2,448 in 2020, adding $784/month to what was already the country’s most expensive rental market. San Francisco (#2 at $3,064) is notable for the opposite reason: its +13% increase was the slowest of any city in the dataset, reflecting significant outmigration, yet it remains the second most expensive market purely on the strength of its pre-pandemic baseline.
The overlap cities. Three cities appear on both lists: San Diego, Miami, and Riverside. All three combined fast growth with high absolute cost. These are arguably the most challenging destinations for mobility programs: transferees face both a high sticker price and a market that moved substantially since any pre-pandemic benchmark was established.
Implications for Mobility Programs
For global mobility and relocation professionals, both charts matter. The percentage-increase table reveals where program budgets have been quietly eroded. The current-rent table reveals where transferees face the heaviest absolute housing burden today. Together, they point to several practical considerations:
► COLA and housing assistance benchmarks tied to pre-2020 baselines are significantly understating current burden across nearly every market in this dataset. A transferee moving to New York today faces a rental market that’s $784/month more expensive than any 2019 benchmark assumed.
► Destination selection conversations are becoming more complex. Cities that once felt affordable when relocation packages were designed — including many Midwest markets — now carry materially higher rental costs.
► Temporary housing and extended stays in the coastal metros at the top of the current-rent table have become extremely expensive. At $3,000+/month (for non-furnished housing) in New York, San Francisco, and Boston, even short-duration assignments that need furnished accommodations carry significant housing cost implications.
► Not all markets moved the same way. San Francisco (+13%) and Austin (+14%) saw dramatically slower growth. Destination-specific benchmarking is essential — a national average adjustment won’t reflect what employees are actually experiencing.
There’s some relief on the horizon. The wave of new multifamily supply that began cresting in 2024 is expected to moderate rent growth in many markets in 2026 and beyond. But the cumulative gap between 2020 baselines and today’s market rates won’t close quickly — and for mobility programs still relying on older benchmarks, the recalibration is overdue.
/Passle/56686a093d94740bd0dda608/SearchServiceImages/2026-07-01-15-12-40-376-6a452e68eb7326b3e7a3f5b4.jpg)
/Passle/56686a093d94740bd0dda608/SearchServiceImages/2026-06-26-14-27-18-871-6a3e8c462f240f5aa11884af.jpg)
/Passle/56686a093d94740bd0dda608/SearchServiceImages/2026-06-26-15-19-07-485-6a3e986bcd48266713b06bdd.jpg)